My name is Dustin Müller. I had chronic tinnitus twice—and both times, it disappeared completely. I also overcame severe chronic fatigue syndrome (CFS), which left me bedridden for more than a year. It’s all documented. It’s all measurable. Here I share what I learned, what I experienced, and the approaches that worked for me.
What You’ll Find on This Page
I.My whole story—from my first episode of sudden hearing loss in 2011 to today.
II.The three main causes: noise, stress, and medications—and why each needs a different treatment approach.
III.My specific approach to a solution—step by step, with supporting evidence.
These are my personal test results, documented by doctors. They are not a promise of results for anyone else.
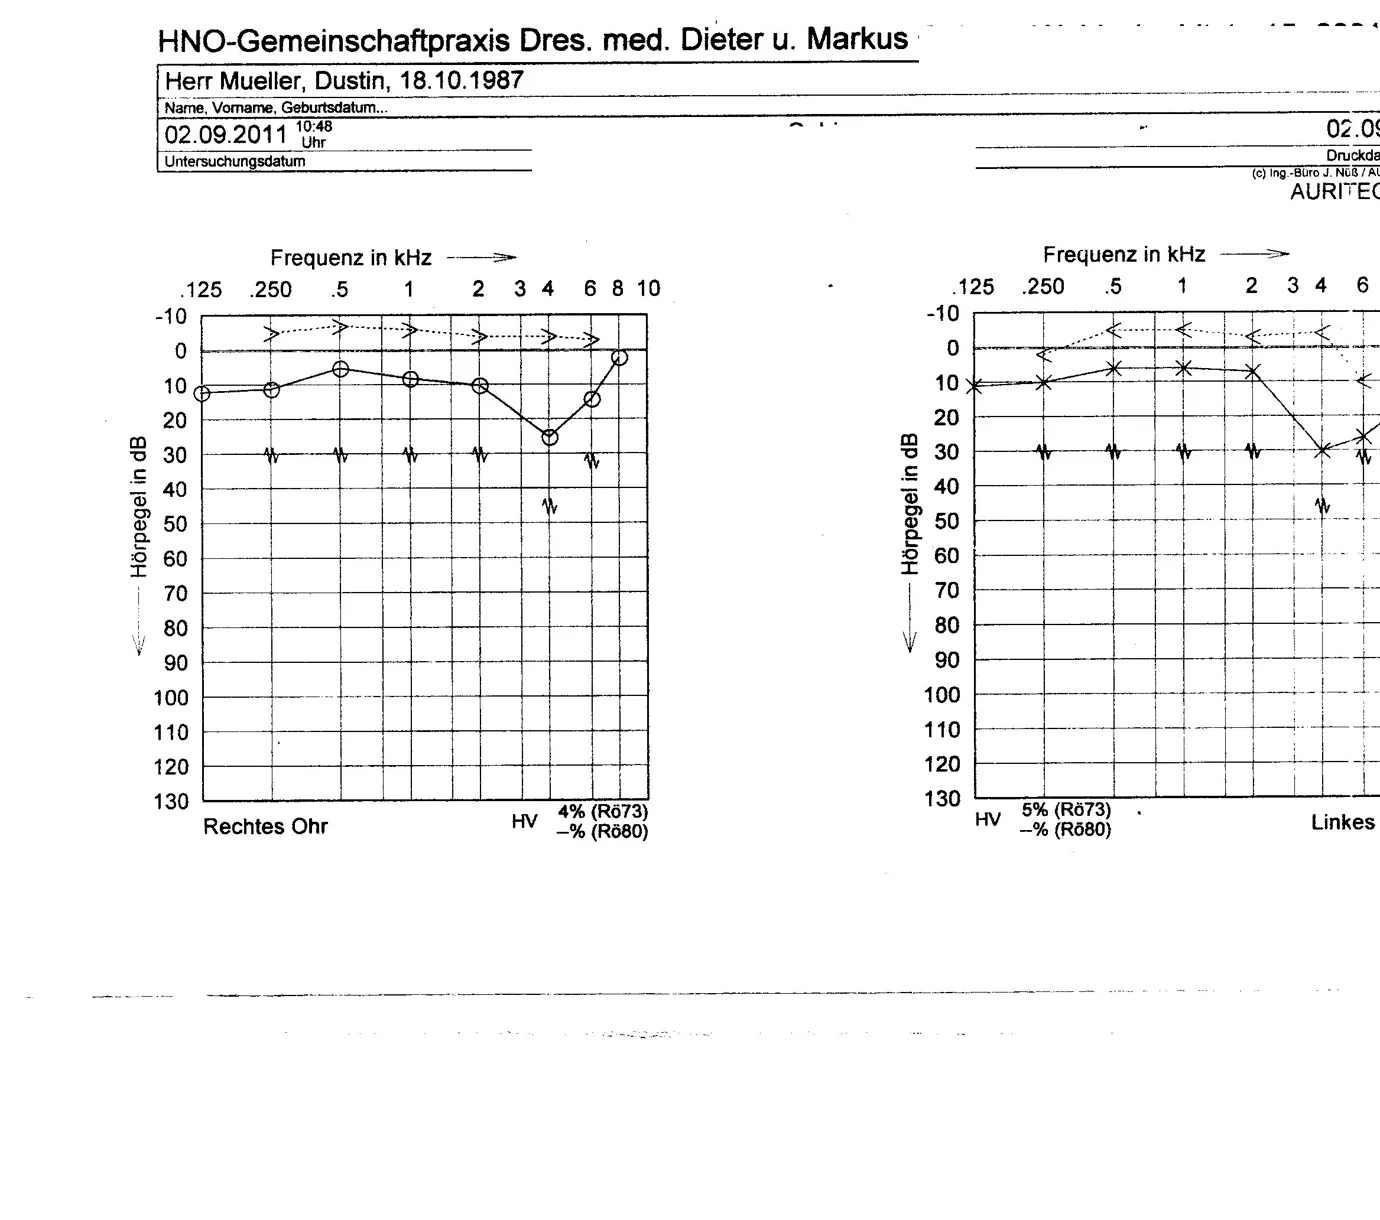
Audiogram 1—transcription of the visible text
Header: ENT group practice of Drs. med. Dieter and Markus [the continuation on the right is cropped].
Patient: Mr. Mueller, Dustin; date of birth shown: October 18, 1987 (18.10.1987 in the original). Form labels: surname, first name, date of birth.
Examination date and time: September 2, 2011 (02.09.2011 in the original), 10:48 a.m. Label: examination date.
Information cropped at the right edge: “02.09…,” the fragment “Druckda…,” “(c) Ing.-Büro J. Nüß / AU…,” and the brand “AURITEC” are visible; the cropped continuations cannot be read from the file.
Graph: right ear
Horizontal axis: “Frequency in kHz,” with an arrow pointing right. Printed marks as shown: .125; .250; .5; 1; 2; 3; 4; 6; 8; 10.
Vertical axis: “Hearing level in dB,” with an arrow pointing down. Marks: −10; 0; 10; 20; 30; 40; 50; 60; 70; 80; 90; 100; 110; 120; 130.
Text below the right-ear graph: “Right ear.” HV (hearing loss): 4% (Rö73); —% (Rö80).
Graph: left ear
Horizontal axis: “Frequency in kHz,” with an arrow pointing right. Fully visible marks: .125; .250; .5; 1; 2; 3; 4; 6. The rest of the axis lies beyond the right edge of the file; marks that are not visible are not reconstructed.
Vertical axis: “Hearing level in dB,” with an arrow pointing down. Marks: −10; 0; 10; 20; 30; 40; 50; 60; 70; 80; 90; 100; 110; 120; 130.
Text below the left-ear graph: HV (hearing loss): 5% (Rö73); —% (Rö80). “Linkes…” is legible in the original; the end of “Linkes Ohr” (“left ear”) is cropped.
Graphical data: The curves, circles, crosses, arrows, and other audiometric symbols do not contain an additional printed numerical table. They remain visually preserved in the original document and are not converted here into approximate values.
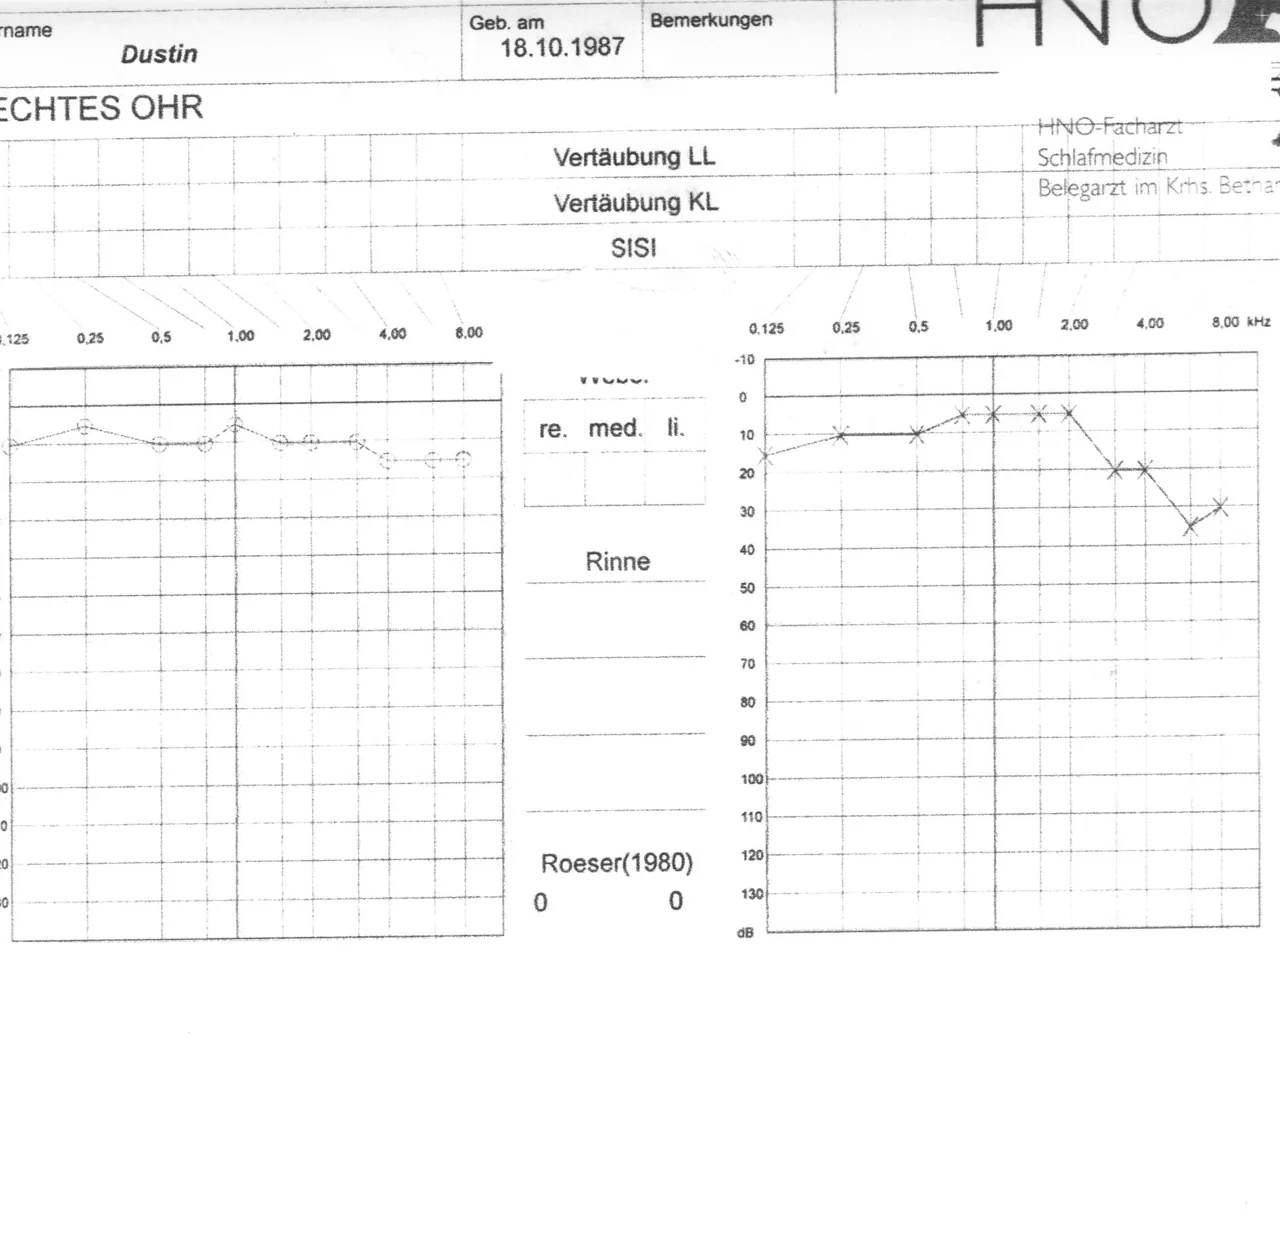
Audiogram 2—transcription of the visible text
Information at the top: first name: Dustin [the beginning of the German label is cropped]; “Born on”: October 18, 1987 (18.10.1987 in the original); “Remarks.” Only part of the “HNOZ…” logo is visible at the upper right.
Header on the left: “Right ear” [the first letter of the German phrase is cropped, but the rest of the label is legible].
Form fields: “Air-conduction masking (LL in the original)”; “Bone-conduction masking (KL in the original)”; “SISI.”
Professional stamp: “Specialist in ear, nose, and throat medicine”; “Sleep medicine”; “Affiliated physician at Betha… hospital” [the continuation of the hospital name is cropped].
Scales on both graphs
Horizontal axis printed on both graphs: 0.125; 0.25; 0.5; 1.00; 2.00; 4.00; 8.00 kHz. On the graph at left, the 0.125 mark is partly cropped; the other marks are legible.
Vertical axis fully legible on the graph at right: −10; 0; 10; 20; 30; 40; 50; 60; 70; 80; 90; 100; 110; 120; 130 dB. The equivalent labels on the graph at left are cropped by the left edge and are not reconstructed from fragments.
Central labels: “right”; “center”; “left”; “Rinne” (shown in the original as “re.”; “med.”; “li.”; “Rinne”).
Assessment at the lower center: “Roeser (1980)”; value on the left: 0; value on the right: 0.
Graphical data: The circles and crosses form the audiometric curves. The form does not print a numerical table beside them; to avoid invented values, they remain graphical information in the original image.
Scan limits: The left edge crops parts of a field name, the “Right ear” label, the first frequency mark, and the left vertical scale; the right edge crops the hospital name and other parts of the form. No continuation beyond those edges is legible.
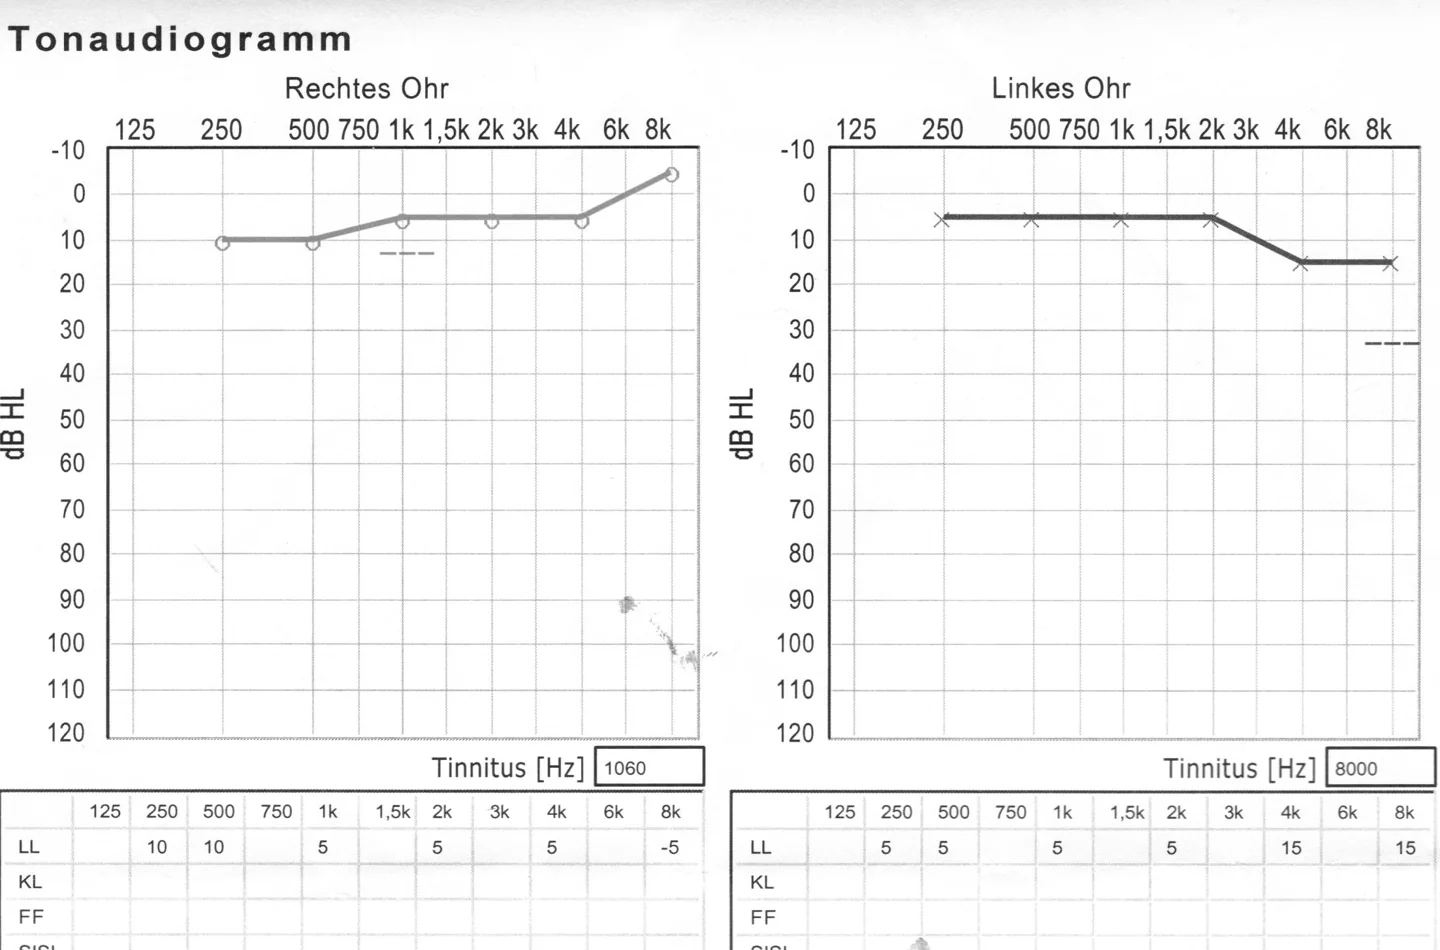
LL (air conduction): 125: no value; 250: 5; 500: 5; 750: no value; 1k: 5; 1.5k: no value; 2k: 5; 3k: no value; 4k: 15; 6k: no value; 8k: 15.
Other visible rows: “KL” (bone conduction), “FF” (sound field), and the beginning of “SISI.” In the visible section, they contain no numerical values. The lower continuation of the table is cropped.
Graphical data: The lines, circles, crosses, and dashed strokes remain preserved in the original image. Explicitly printed values are listed above; unlabeled strokes are not converted into approximate values.
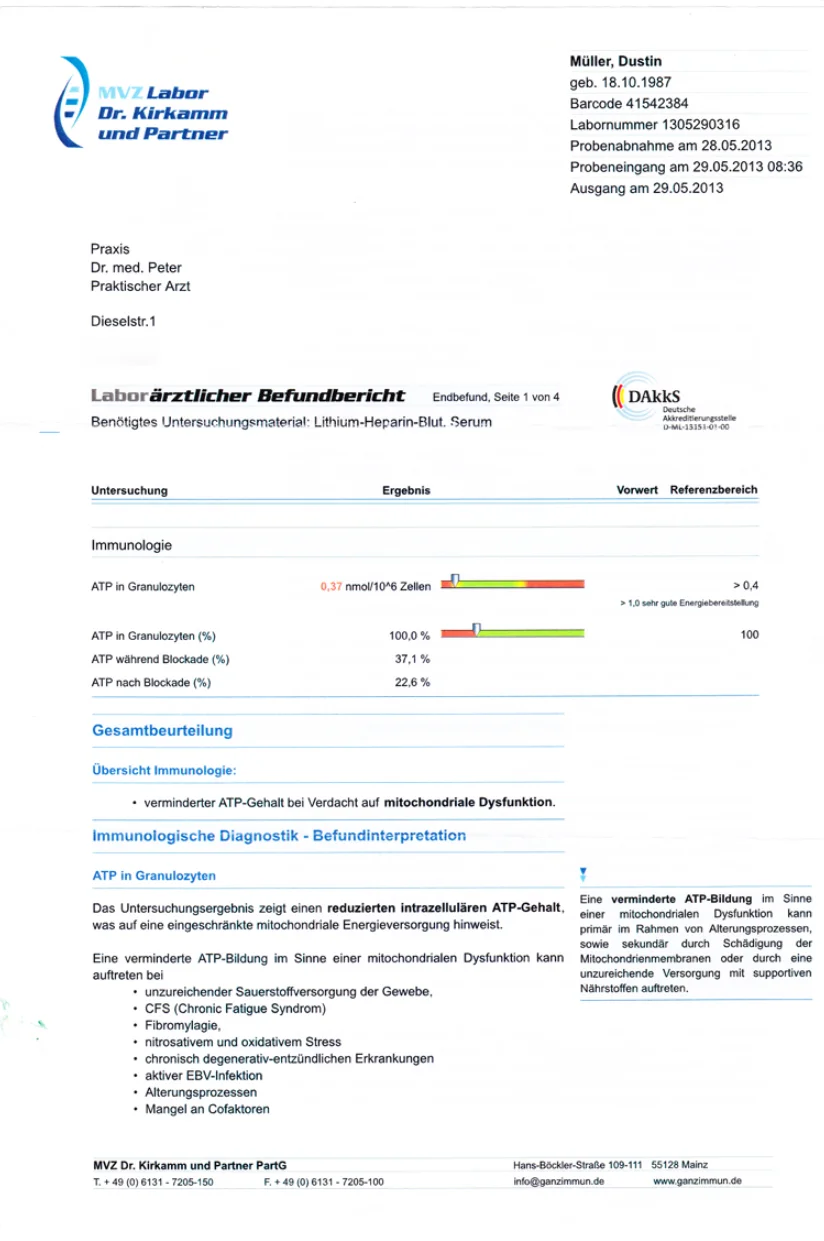
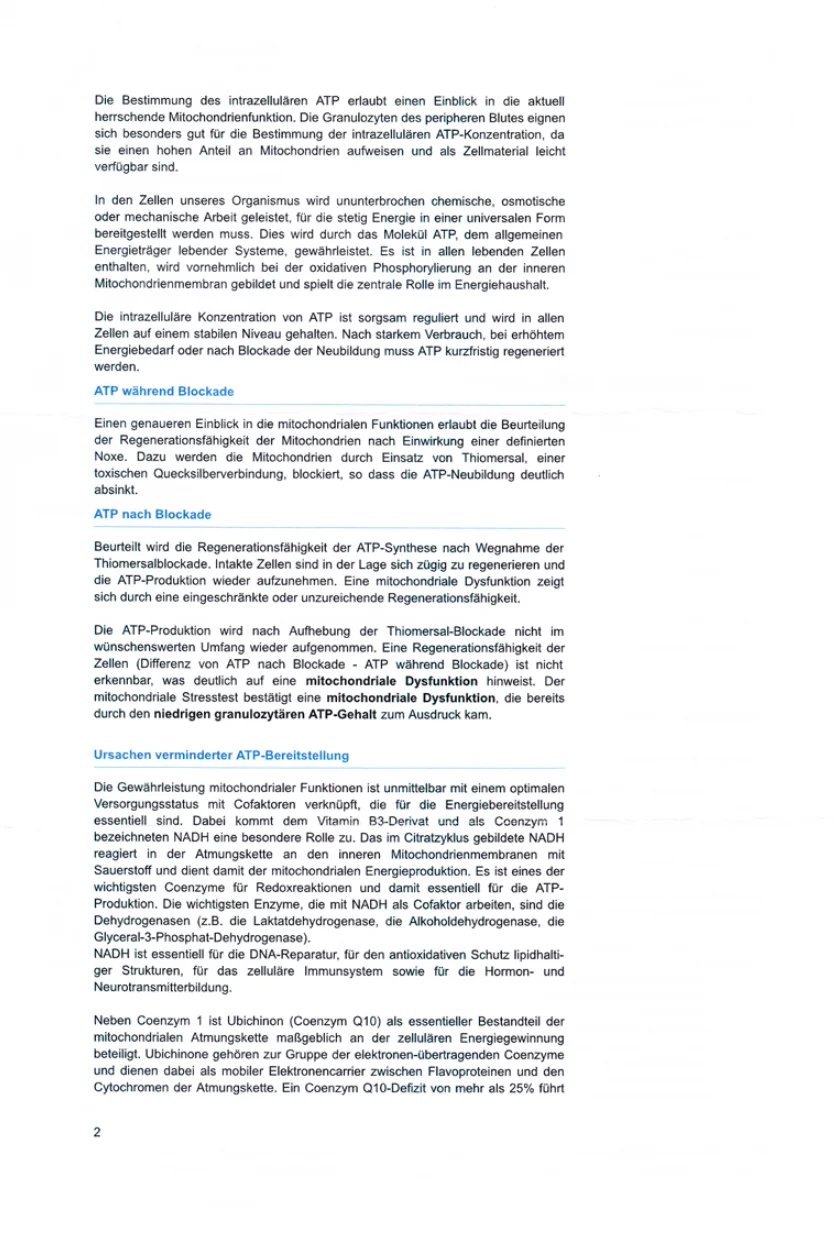
ATP profile—medical laboratory report, page 1
Laboratory: MVZ Labor Dr. Kirkamm und Partner.
Patient: Müller, Dustin; born October 18, 1987 (18.10.1987 in the original).
Barcode: 41542384. Laboratory number: 1305290316.
Sample collected: May 28, 2013 (28.05.2013 in the original). Sample received: May 29, 2013 (29.05.2013 in the original), 08:36. Issued: May 29, 2013 (29.05.2013 in the original).
Practice: Dr. med. Peter; general practitioner; Dieselstr. 1. No surname after “Peter” is legible in the document.
Document: “Medical laboratory report.” Final report, page 1 of 4.
Material required for the test: lithium-heparin blood; serum.
Determining intracellular ATP provides insight into the current state of mitochondrial function. Granulocytes from peripheral blood are particularly suitable for determining intracellular ATP concentration because they contain a high proportion of mitochondria and are readily available as cellular material.
Our body’s cells continuously perform chemical, osmotic, or mechanical work, for which energy must constantly be made available in a universal form. This is provided by the ATP molecule, the general energy carrier of living systems. ATP is present in every living cell, is formed mainly during oxidative phosphorylation at the inner mitochondrial membrane, and plays the central role in energy metabolism.
Intracellular ATP concentration is carefully regulated and kept at a stable level in all cells. After intensive ATP consumption, increased energy demand, or inhibition of new ATP formation, ATP must be regenerated promptly.
ATP during blockade
Assessing the mitochondria’s ability to regenerate after exposure to a defined harmful agent provides deeper insight into mitochondrial function. For this purpose, the mitochondria are blocked with thiomersal, a toxic mercury compound, so that new ATP formation drops markedly.
ATP after blockade
The test assesses the ability of ATP synthesis to recover after the thiomersal blockade is removed. Intact cells can recover quickly and resume ATP production. Mitochondrial dysfunction appears as limited or insufficient recovery capacity.
ATP production does not resume to the desired extent after the thiomersal blockade is removed. No recovery capacity of the cells is detectable (difference between ATP after blockade and ATP during blockade), which clearly indicates mitochondrial dysfunction. The mitochondrial stress test confirms mitochondrial dysfunction that was already evident from the low ATP content in granulocytes.
Causes of reduced ATP availability
Maintaining mitochondrial function is directly linked to an optimal supply of cofactors that are essential for energy availability. NADH, a vitamin B3 derivative known as coenzyme 1, plays a special role. NADH formed in the citric acid cycle reacts with oxygen in the respiratory chain at the inner mitochondrial membranes and thereby contributes to mitochondrial energy production. It is one of the most important coenzymes in oxidation-reduction reactions and is therefore essential for ATP production. The most important enzymes that use NADH as a cofactor are dehydrogenases—for example lactate dehydrogenase, alcohol dehydrogenase, and glyceraldehyde-3-phosphate dehydrogenase.
NADH is essential for DNA repair, antioxidant protection of lipid-containing structures, cellular immune function, and the formation of hormones and neurotransmitters.
In addition to coenzyme 1, ubiquinone (coenzyme Q10), as an essential component of the mitochondrial respiratory chain, plays a decisive role in cellular energy production. Ubiquinones belong to the group of electron-transporting coenzymes and act as mobile electron carriers between flavoproteins and cytochromes in the respiratory chain. A coenzyme Q10 deficiency of more than 25% leads… [the sentence continues beyond the lower edge of the file and the continuation is not legible].
Printed page number: 2.
Section 01
Why This Site Exists
I know exactly what it feels like to lie awake at night, unable to switch that sound off. I know what it’s like to hear a doctor tell you, “Learn to live with it.” And I know what it’s like to feel completely alone with a problem no one else can see.
Fall 2011, my first time ever at a club. My cousin had talked me into going—“It’s not as crowded as other clubs. It’s so much fun.” Even on the stairs going down, a good 40 meters from the room, I could really feel the bass. Naive as I was, I stood in the best available spot: just six to eight meters in front of the speakers. Four hours. The next morning, I tipped to the left as I got up, and on day three I was hearing sounds in both ears that weren’t there.
The first ENT doctor took a quick look, said, “Yeah, don’t pay attention to it—listen to some music,” and walked out of the room. The second prescribed ginkgo. The fourth was a tinnitus specialist and explained that the sound was now coming from my brain. Six ENT doctors—four in doctors’ offices, two at the university hospital. None of them could help me.
So I started reading up on it myself. At night on the tinnitus.de forum, later with my laptop in a hospital bed. Thousands of hours, over years—cell biology, cochlear physiology, neurology, nutritional biochemistry. Not because I found it fascinating. But because no doctor could tell me what was actually happening in my ear.
I found the solution not in a lab, but in the living room. Back then, my father was giving himself vitamin B12 injections for a nerve disease—a little ampule of red liquid. My own B12 level was barely above the deficiency threshold, but my family doctor still wouldn’t give me an injection. So one evening I let my father give me one, feeling really uneasy about it. And what can I say—the next morning, the sound was a good 40 percent quieter. From then on, it was detective work—lecithin, the full B complex, months of silence. After a good year and a half, 80 percent was gone; eventually, there was nothing left. Nothing. The third audiogram above is from that 80-percent stage.
Years later, I deliberately brought on tinnitus a second time—headphones cranked up for weeks—to test whether my model was right. I know how that reads. It was right: this time, the tinnitus was gone in three to four months.
This site exists because it’s exactly what I would have needed back then. Not every path works for every person. But everything I’ve found out over the years is here—with the medical records, with all the dead ends. And if my experiences and research help even one person with tinnitus find hope again, then every hour I’ve put into this site has been worth it.
What to Expect on This Page
My whole story
My path from my first episode of sudden hearing loss through six fruitless ENT visits and my plunge into CFS, then finally back to life—told in full, uncensored, with every setback included.
Not all tinnitus is the same. Based on my experience and research, there are three fundamentally different triggers—and each one calls for a different approach.
Noise-induced tinnitus
Clubs, concerts, acoustic trauma from a loud bang, chronic noise exposure—when the ear has been mechanically overloaded, its hair cells get stuck in an energy-starved emergency mode. Here I explain the entire cellular mechanism: what happens at the molecular level, why the tone persists, and why conventional masking therapy can provide short-term relief but, as I understand it, works against the ear’s actual regeneration.
Not all tinnitus comes from the ear. Long-standing unresolved inner conflicts can generate persistent electrical potentials in the nervous system that stimulate the auditory system from within. Here I describe how that model works. I also explain how working through those conflicts helped me during a separate period of CFS and psychosomatic symptoms. I never had stress-induced tinnitus myself.
Medication- and toxin-induced tinnitus (ototoxicity)
Certain medications, heavy metals, and environmental toxins can chemically attack the hair cells and the auditory nerve from within. Here I explain the mechanisms behind the major ototoxic substances and why this kind of tinnitus is often especially stubborn.
More than 80 scientific studies cover all the mechanisms, treatment avenues, and clinical applications I describe on this site. If you want to dig deeper into the research, you’ll find the full scientific basis here.
What exactly did I do about chronic, noise-induced tinnitus? Which three pillars were crucial? And why does my approach align with both current pharmaceutical research (AC102) and low-level laser therapy? Here I lay out my exact process—step by step.
Important note: If you have tinnitus or hearing problems—especially if they came on suddenly—please see an ENT doctor to be checked for organic causes.
Section 02
Contact
Write to me. I read every email myself—just be a little patient. I’ll reply as quickly as I can.