Records
Medical Records and Test Results
This is where I’m gradually collecting my medical records and other proof. The page is still under construction—more documents will be added.
Audiograms Taken over the Course of My First Tinnitus Episode
Audiogram 1
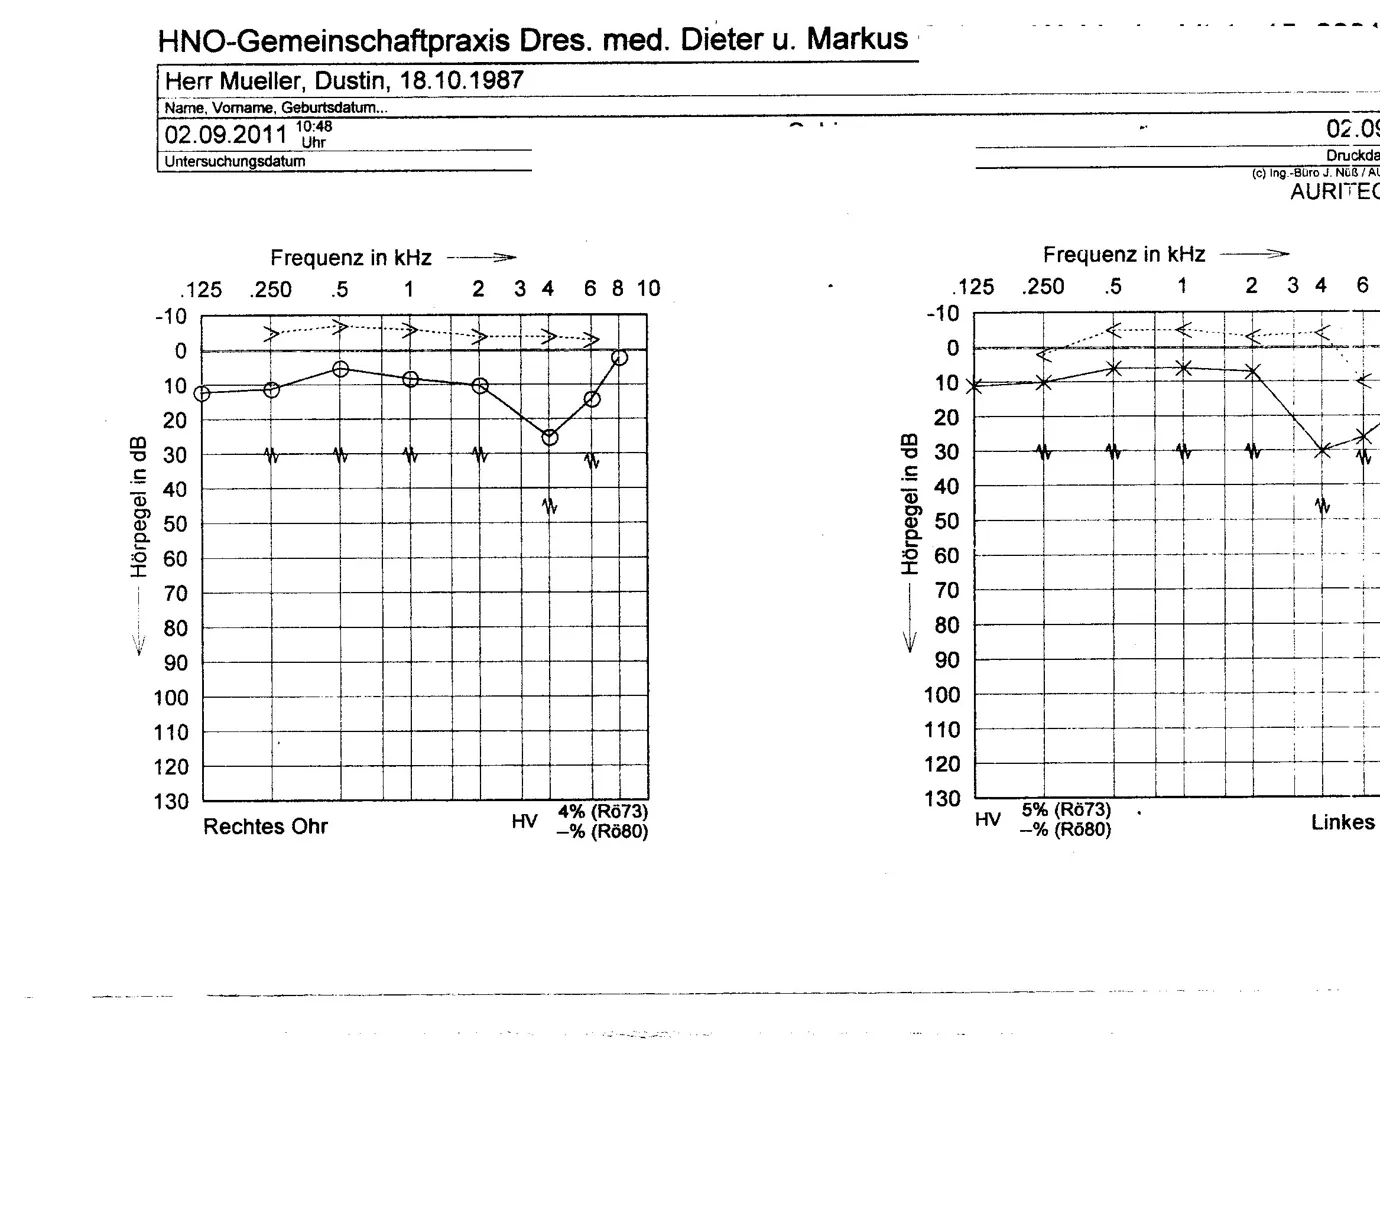
September 2, 2011—my oldest surviving hearing test, ENT group practice.
View larger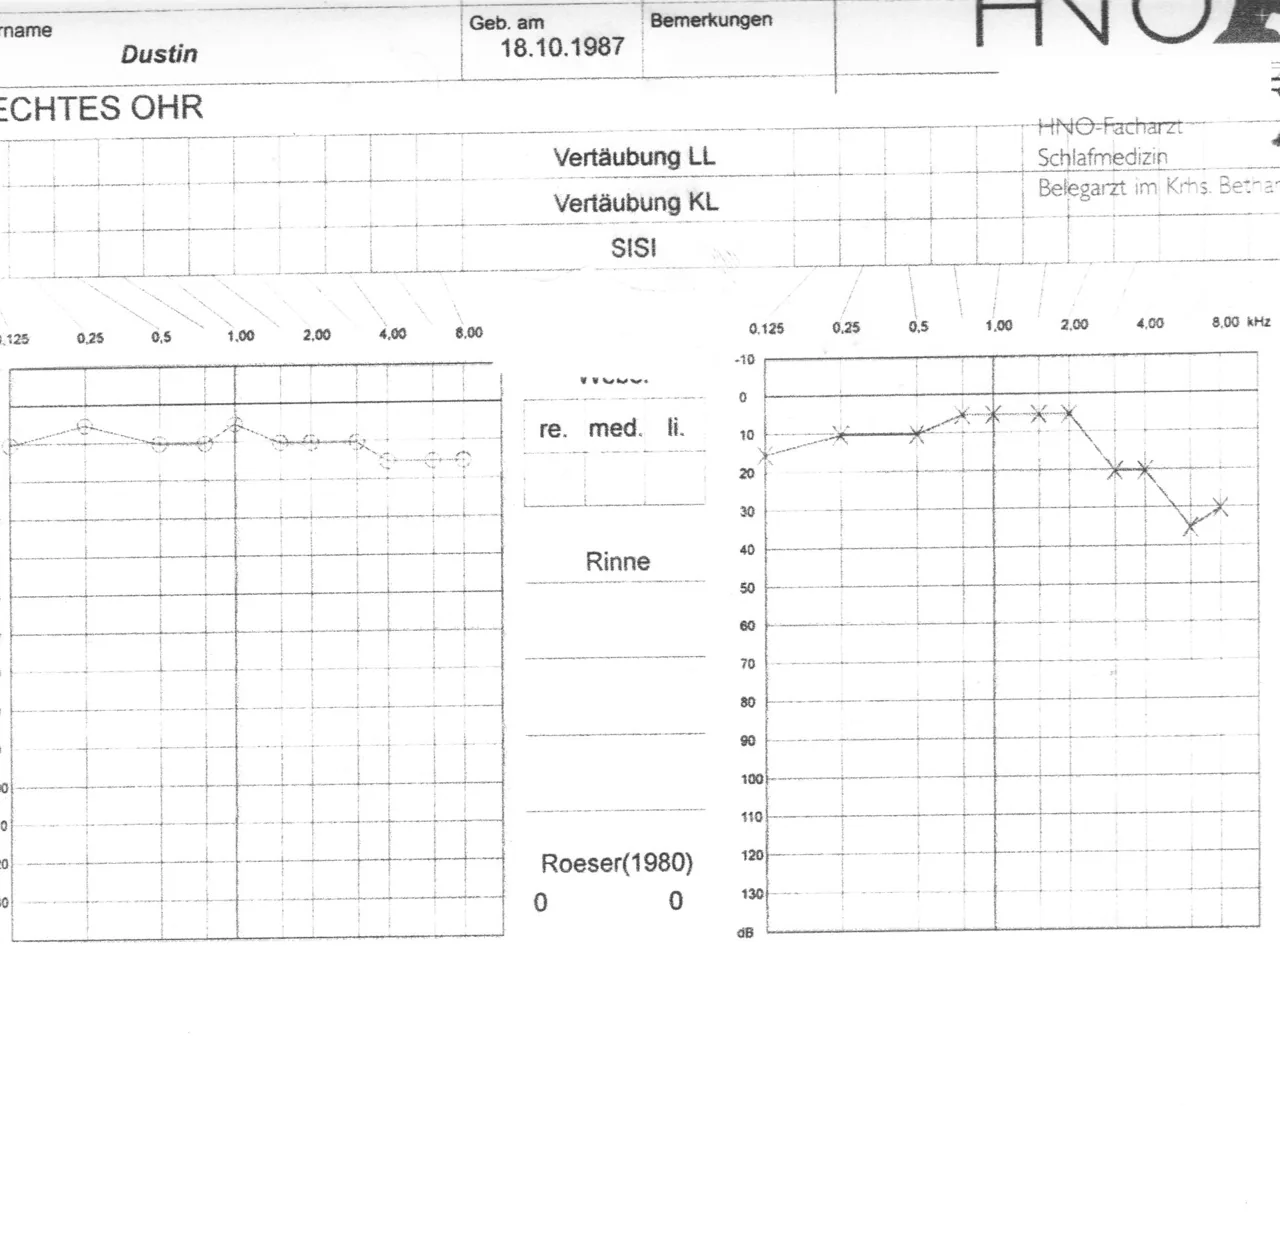
Audiogram 2
ENT specialist / sleep medicine—a repeat hearing test later on.
View largerAudiogram 3
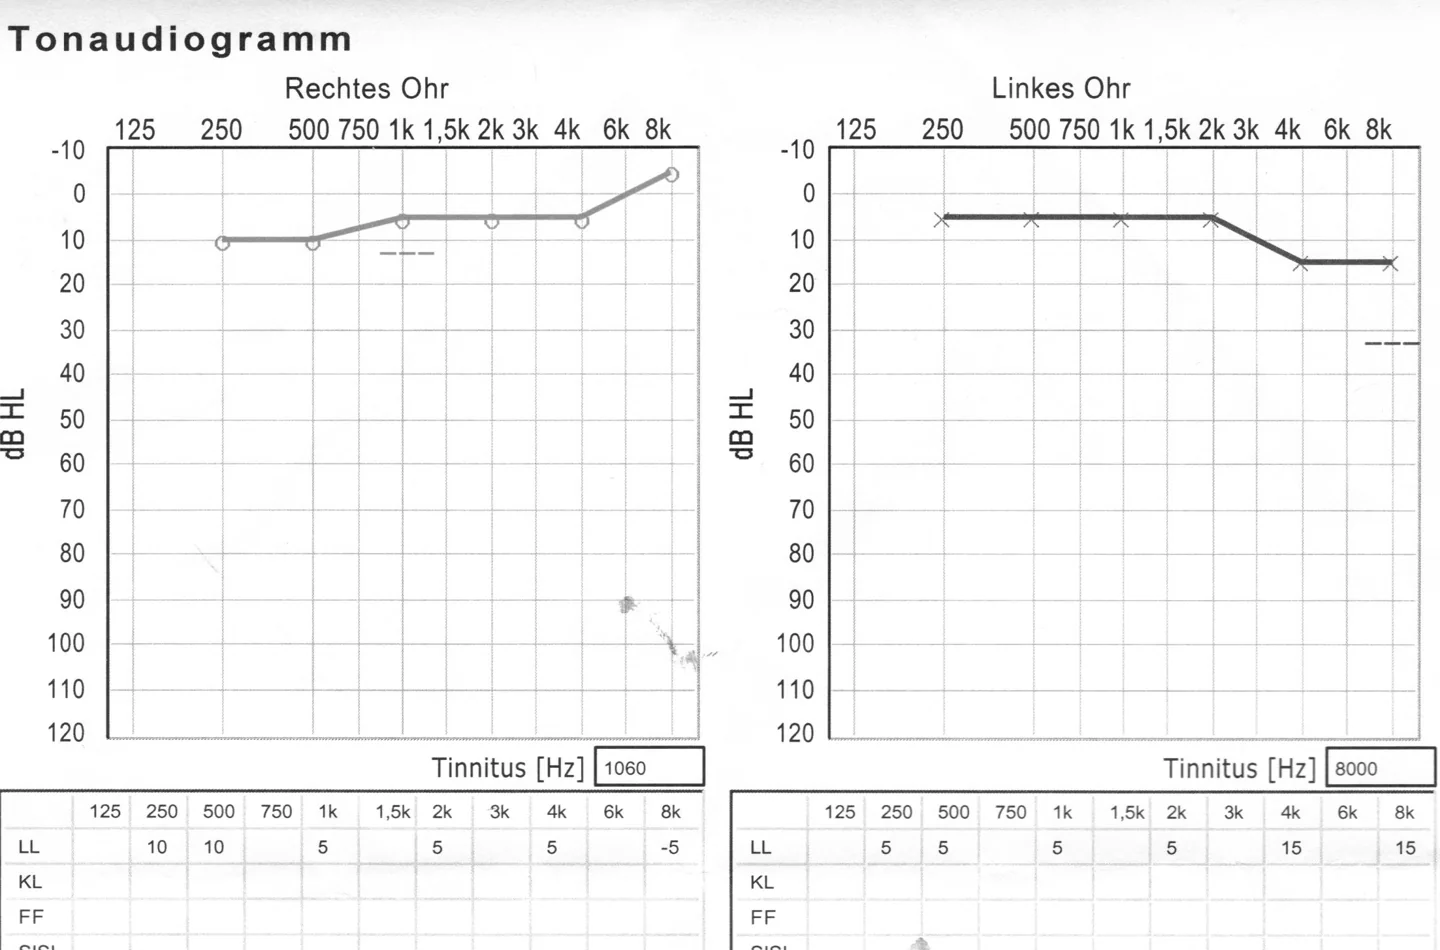
Pure-tone audiogram taken during recovery.
View largerOn my sources page, I’ve put together a detailed look at how hearing loss, audiometry, and tinnitus are connected.
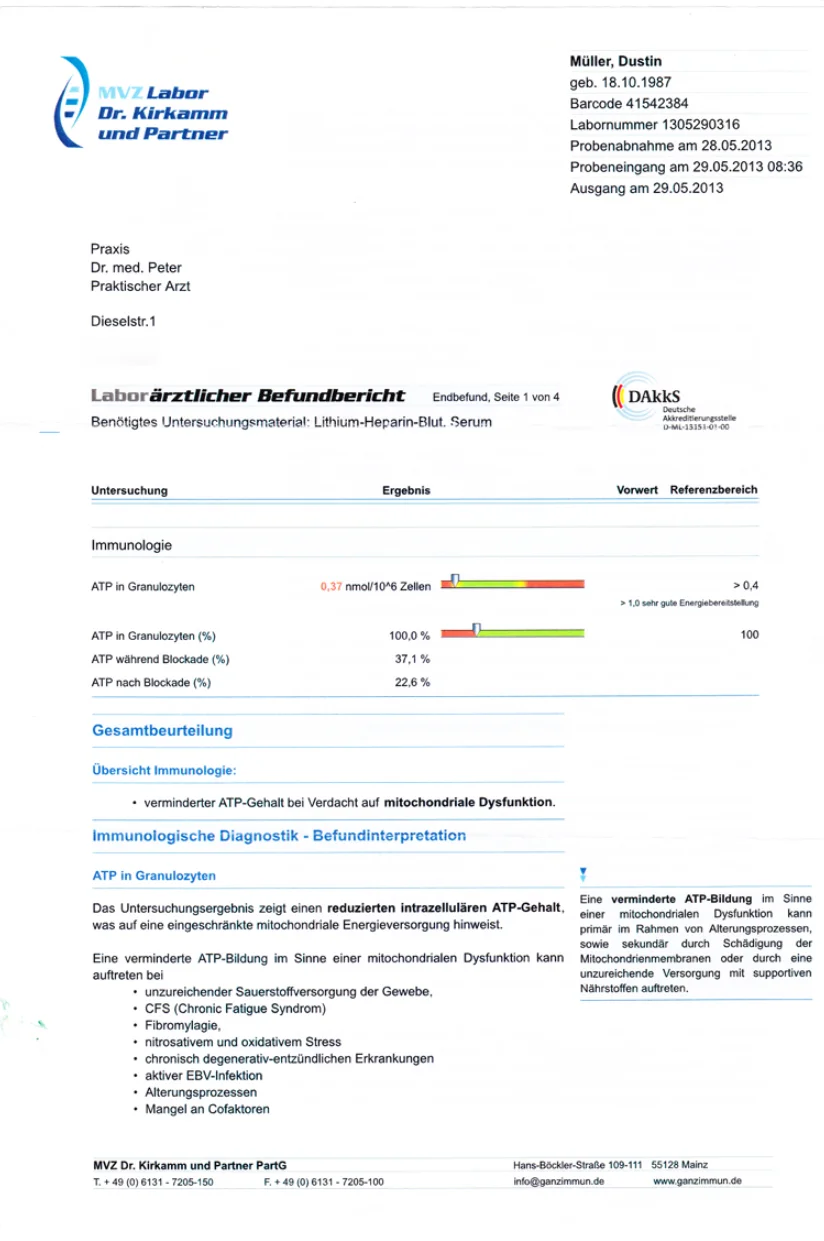
ATP Level While I Had CFS: 0.37
These are my personal test results, documented by doctors. They are not a promise of results for anyone else.
Audiogram 1—English translation of the visible text
Header: ENT group practice [the doctors’ names are omitted here; the rest of the line is covered in the scan and not legible]. A field in the middle of the date line is also covered and not legible.
Patient: Mr. Mueller, Dustin; date of birth [omitted here]. Form labels: last name, first name, date of birth.
Examination date and time: September 2, 2011 (02.09.2011 in the original), 10:48 a.m. Label: examination date.
Information cropped at the right edge: “02.09…,” the fragment “Druckda…,” “(c) Ing.-Büro J. Nüß / AU…,” and the brand “AURITEC” are visible; the cropped continuations cannot be read from the file.
Graph: right ear
Horizontal axis: “Frequency in kHz,” with an arrow pointing right. Printed marks as shown: .125; .250; .5; 1; 2; 3; 4; 6; 8; 10.
Vertical axis: “Hearing level in dB,” with an arrow pointing down. Marks: −10; 0; 10; 20; 30; 40; 50; 60; 70; 80; 90; 100; 110; 120; 130.
Text below the right-ear graph: “Right ear.” HV (hearing loss): 4% (Rö73); —% (Rö80).
Graph: left ear
Horizontal axis: “Frequency in kHz,” with an arrow pointing right. Fully visible marks: .125; .250; .5; 1; 2; 3; 4; 6. The rest of the axis lies beyond the right edge of the file; marks that are not visible are not reconstructed.
Vertical axis: “Hearing level in dB,” with an arrow pointing down. Marks: −10; 0; 10; 20; 30; 40; 50; 60; 70; 80; 90; 100; 110; 120; 130.
Text below the left-ear graph: HV (hearing loss): 5% (Rö73); —% (Rö80). “Linkes…” is legible in the original; the end of “Linkes Ohr” (“left ear”) is cropped.
Graphical data: No numerical table is printed alongside the curves, circles, crosses, arrows, and other audiometric symbols. They appear only graphically in the original and are not converted into approximate values here.
Audiogram 2—English translation of the visible text
Information at the top: first name: Dustin [the beginning of the German label is cropped]; “Born on”: [date of birth omitted here]; “Remarks.” Only part of a logo is visible at the upper right: the letters “HNO,” followed by a dark shape that is cut off by the edge and cannot be identified.
Header on the left: “Right ear” [the first letter of the German phrase is cropped, but the rest of the label is legible].
Form fields: “Air-conduction masking” (“Vertäubung LL” in the original); “Bone-conduction masking” (“Vertäubung KL”); “SISI.”
Text at the upper right (stamp or letterhead; the scan does not show which): “Specialist in ear, nose, and throat medicine”; “Sleep medicine”; “Affiliated physician at Betha… hospital” [the rest of the hospital name is cut off by the right edge].
Scales on both graphs
Horizontal axis printed on both graphs: 0.125; 0.25; 0.5; 1.00; 2.00; 4.00; 8.00 kHz. On the graph at left, the 0.125 mark is partly cropped; the other marks are legible.
Vertical axis fully legible on the graph at right: −10; 0; 10; 20; 30; 40; 50; 60; 70; 80; 90; 100; 110; 120; 130 dB. The equivalent labels on the graph at left are cropped by the left edge and are not reconstructed from fragments.
Central labels: a heading of which only the lower half of the letters is visible (in context, “Weber,” the Weber tuning-fork test); below it “right”; “midline”; “left” (“re.”; “med.”; “li.” in the original); further down “Rinne.”
Assessment at the lower center: “Roeser (1980)”; value on the left: 0; value on the right: 0.
Graphical data: The circles and crosses form the audiometric curves. The form does not print a numerical table beside them; to avoid invented values, they remain graphical information in the original image.
Scan limits: The left edge crops parts of a field name, the “Right ear” label, the first frequency mark, and the left vertical scale; the right edge crops the hospital name and other parts of the form. No continuation beyond those edges is legible. The top edge cuts off the upper part of the logo.
Audiogram 3—English translation of the visible text
Document title: “Pure-tone audiogram.”
Right ear
Horizontal axis: 125; 250; 500; 750; 1k; 1.5k; 2k; 3k; 4k; 6k; 8k. Vertical axis: dB HL, with marks −10; 0; 10; 20; 30; 40; 50; 60; 70; 80; 90; 100; 110; 120.
Tinnitus [Hz], right ear: 1060.
Right-ear table—columns: 125; 250; 500; 750; 1k; 1.5k; 2k; 3k; 4k; 6k; 8k.
LL (air conduction): 125: no value; 250: 10; 500: 10; 750: no value; 1k: 5; 1.5k: no value; 2k: 5; 3k: no value; 4k: 5; 6k: no value; 8k: −5.
Left ear
Horizontal axis: 125; 250; 500; 750; 1k; 1.5k; 2k; 3k; 4k; 6k; 8k. Vertical axis: dB HL, with marks −10; 0; 10; 20; 30; 40; 50; 60; 70; 80; 90; 100; 110; 120.
Tinnitus [Hz], left ear: 8000.
Left-ear table—columns: 125; 250; 500; 750; 1k; 1.5k; 2k; 3k; 4k; 6k; 8k.
LL (air conduction): 125: no value; 250: 5; 500: 5; 750: no value; 1k: 5; 1.5k: no value; 2k: 5; 3k: no value; 4k: 15; 6k: no value; 8k: 15.
Other visible rows: “KL” (bone conduction), “FF” (sound field), and the beginning of “SISI.” In the visible section, they contain no numerical values. The lower continuation of the table is cropped.
Graphical data: The lines, circles, crosses, and dashed strokes remain preserved in the original image. Explicitly printed values are listed above; unlabeled strokes are not converted into approximate values.
ATP report, page 1—English translation of the visible text
Laboratory: MVZ Labor Dr. Kirkamm und Partner.
Patient: Müller, Dustin; date of birth [omitted here].
Sample collected: May 28, 2013 (28.05.2013 in the original). Sample received: May 29, 2013 (29.05.2013 in the original), 8:36 a.m. Issued: May 29, 2013 (29.05.2013 in the original).
Practice: a general practitioner [name and street omitted here].
Document: “Medical laboratory report.” Final report, page 1 of 4.
Material required for the test: lithium-heparin blood; serum.
Accreditation: DAkkS—German Accreditation Body. Code: D-ML-13151-01-00.
Table headings: test; result; previous value; reference range.
Section: Immunology.
ATP in granulocytes: 0.37 nmol/10⁶ cells. Reference range: > 0.4. Scale note: > 1.0, very good energy availability.
ATP in granulocytes (%): 100.0%. Printed reference value: 100.
ATP during blockade (%): 37.1%.
ATP after blockade (%): 22.6%.
In the original, the result 0.37 is printed in red; the first two results each have a colored bar scale with a pointer, which remains graphical information in the original image.
Overall assessment
Immunology summary: reduced ATP content, with suspected mitochondrial dysfunction.
Immunological diagnostics—interpretation of results
ATP in granulocytes
The test result shows reduced intracellular ATP content, indicating a limited mitochondrial energy supply.
Reduced ATP formation consistent with mitochondrial dysfunction can occur in the following situations:
- inadequate oxygen supply to tissue;
- CFS (chronic fatigue syndrome);
- fibromyalgia;
- nitrosative and oxidative stress;
- chronic degenerative-inflammatory diseases;
- active EBV infection;
- aging processes;
- lack of cofactors.
Report footer: MVZ Dr. Kirkamm und Partner PartG [address and contact details omitted here].
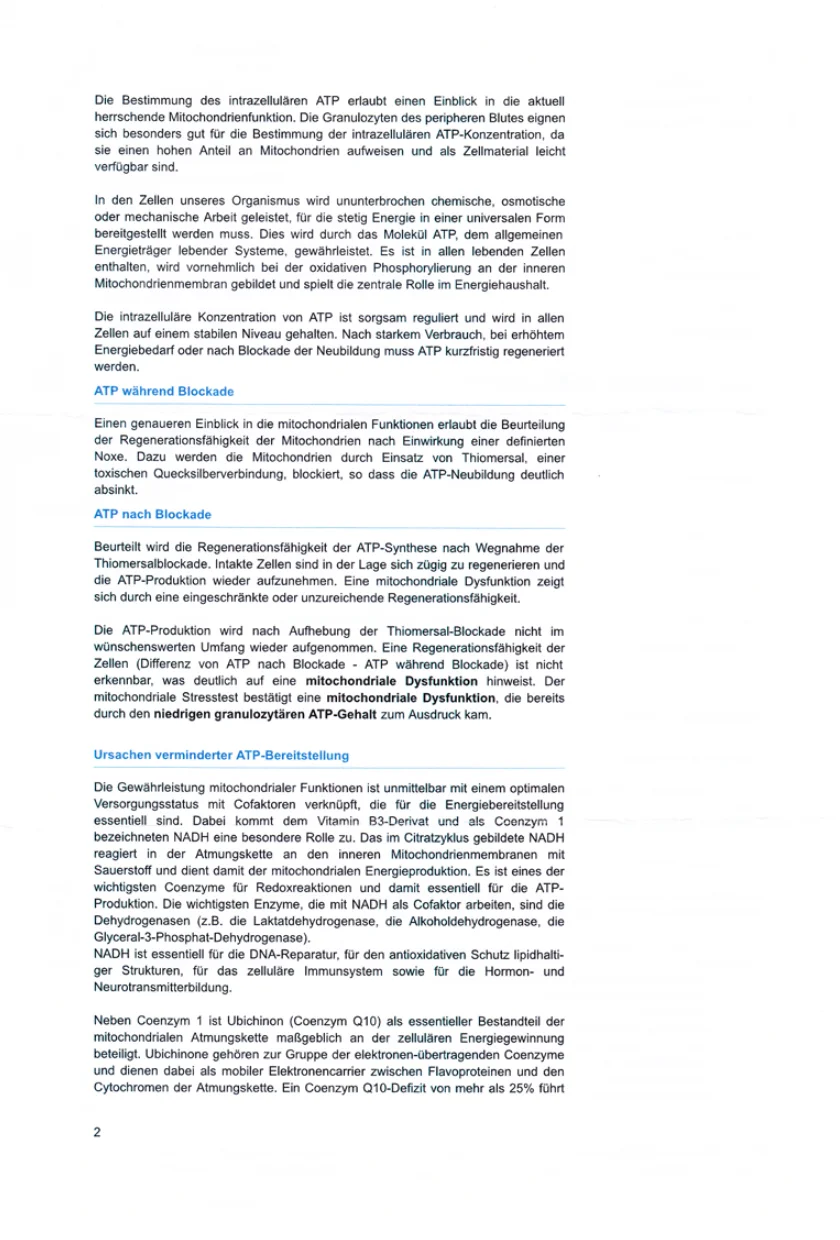
ATP report, page 2—English translation of the visible text
Determining intracellular ATP provides insight into the current state of mitochondrial function. Granulocytes from peripheral blood are particularly suitable for determining intracellular ATP concentration because they contain a high proportion of mitochondria and are readily available as cellular material.
Our body’s cells continuously perform chemical, osmotic, or mechanical work, for which energy must constantly be made available in a universal form. This is provided by the ATP molecule, the general energy carrier of living systems. ATP is present in every living cell, is formed mainly during oxidative phosphorylation at the inner mitochondrial membrane, and plays the central role in energy metabolism.
Intracellular ATP concentration is carefully regulated and kept at a stable level in all cells. After heavy consumption, during increased energy demand, or after a blockade of new ATP formation, ATP must be regenerated promptly.
ATP during blockade
Assessing the mitochondria’s ability to regenerate after exposure to a defined harmful agent provides deeper insight into mitochondrial function. For this purpose, the mitochondria are blocked with thimerosal (thiomersal), a toxic mercury compound, so that new ATP formation drops markedly.
ATP after blockade
The test assesses the regenerative capacity of ATP synthesis after the thimerosal blockade is removed. Intact cells can regenerate quickly and resume ATP production. Mitochondrial dysfunction appears as limited or insufficient regenerative capacity.
ATP production does not resume to the desired extent after the thimerosal blockade is removed. No regenerative capacity of the cells (difference between ATP after blockade and ATP during blockade) is detectable, which clearly indicates mitochondrial dysfunction. The mitochondrial stress test confirms mitochondrial dysfunction that was already reflected in the low ATP content in granulocytes.
Causes of reduced ATP availability
Maintaining mitochondrial function is directly linked to an optimal supply of cofactors that are essential for energy availability. NADH, a vitamin B3 derivative known as coenzyme 1, plays a special role. NADH formed in the citric acid cycle reacts with oxygen in the respiratory chain at the inner mitochondrial membranes and thereby contributes to mitochondrial energy production. It is one of the most important coenzymes in oxidation-reduction reactions and is therefore essential for ATP production. The most important enzymes that use NADH as a cofactor are dehydrogenases—for example lactate dehydrogenase, alcohol dehydrogenase, and “glyceral-3-phosphate dehydrogenase” [sic; misprint in the original].
NADH is essential for DNA repair, antioxidant protection of lipid-containing structures, cellular immune function, and the formation of hormones and neurotransmitters.
In addition to coenzyme 1, ubiquinone (coenzyme Q10), as an essential component of the mitochondrial respiratory chain, plays a decisive role in cellular energy production. Ubiquinones belong to the group of electron-transporting coenzymes and act as mobile electron carriers between flavoproteins and cytochromes in the respiratory chain. A coenzyme Q10 deficiency of more than 25% leads… [the sentence continues on page 3 of the four-page report, which is not shown here].
Printed page number: 2.